VAU Technical Analysis
Last updated: October 23, 2025 at 11:36 PM
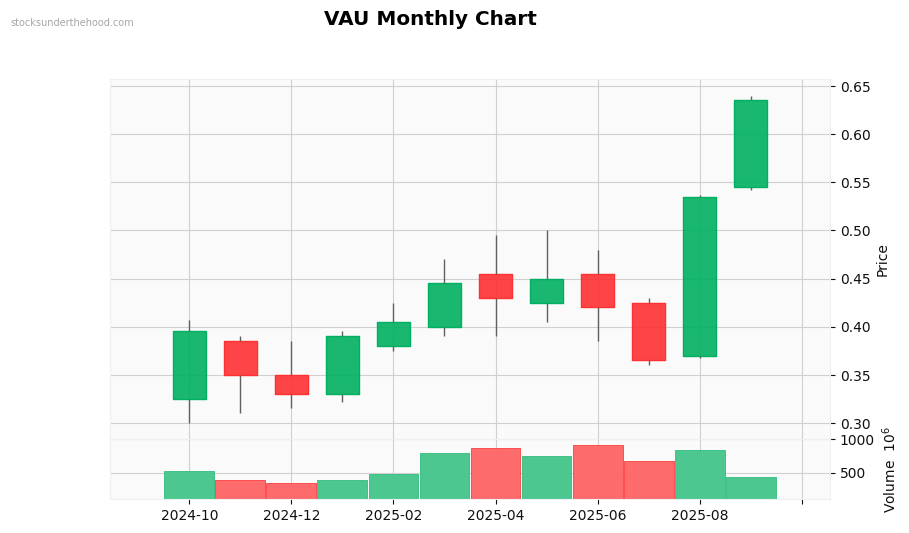
Monthly Observations: Performance: +79.7% (10Y). Volume data insufficient. Currently in a strong uptrend. High volatility stock. Down 10.7% from highs. Strong 6-month momentum. Price is at recent highs.
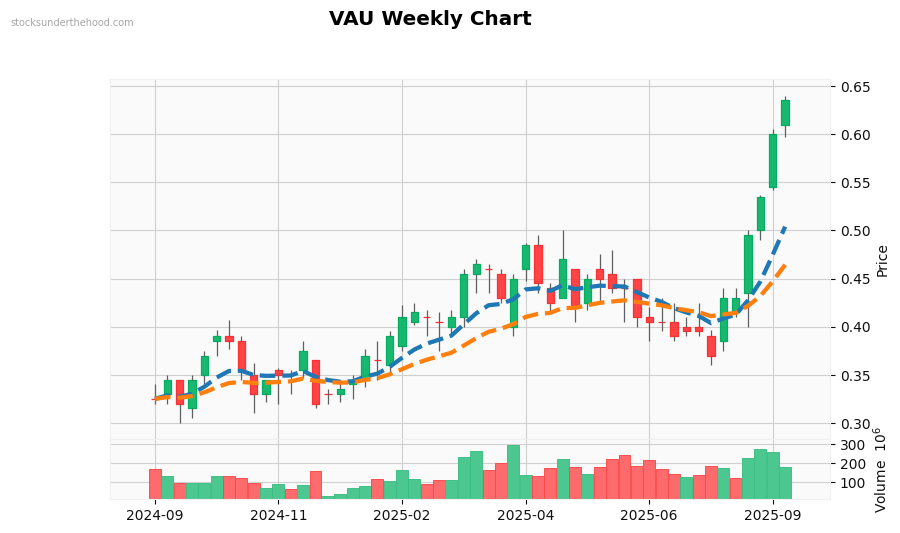
Weekly Observations: Performance: +118.5% (2Y). Volume is significantly above average. with strong buying interest. Recent volume spike detected. Currently in a strong uptrend. Trading above EMA10. Trading above EMA21. Price is above all EMAs (bullish signal). EMAs are stacked bullishly. Price is near recent highs.
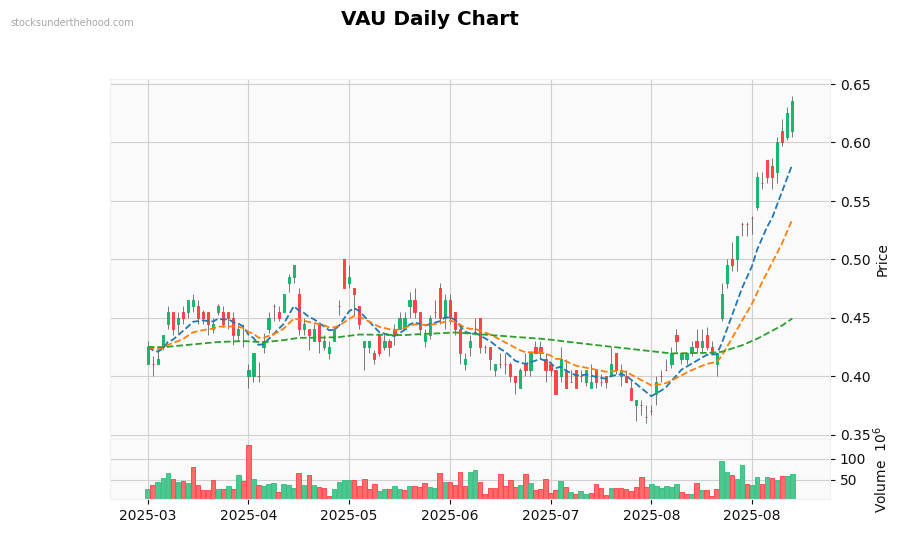
Daily Observations: Performance: +82.1% (1Y). Volume is significantly above average. with strong buying interest. Recent volume spike detected. Currently in a strong downtrend. Trading below EMA10. Trading above EMA21. Trading above EMA125. Price is above most EMAs (positive). EMAs are stacked bullishly. Price is near recent highs.