RRL Technical Analysis
Last updated: October 23, 2025 at 11:33 PM
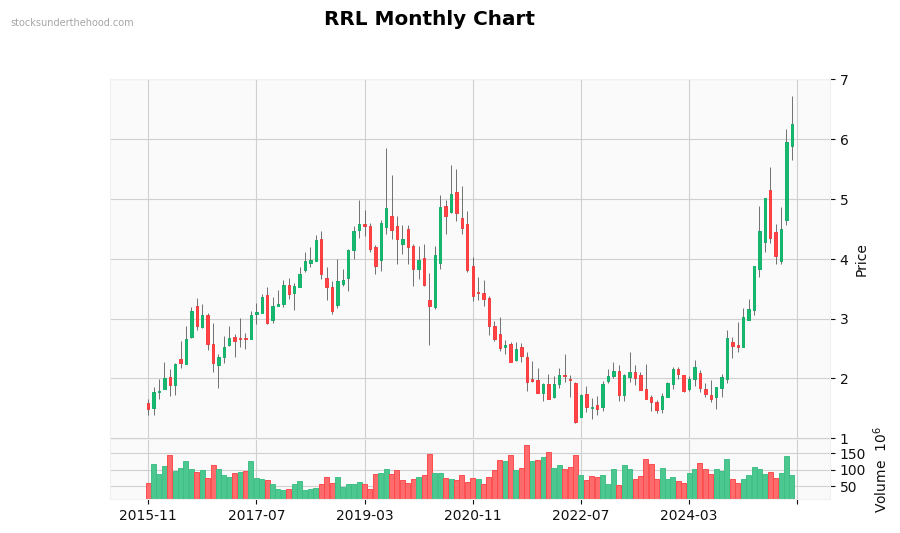
Monthly Observations: Performance: +320.9% (10Y). Volume is near average. Currently in a strong uptrend. Strong long-term uptrend (+264.8% over 2 years). Moderate volatility. Down 7.1% from highs. Strong 6-month momentum. Price is at recent highs.
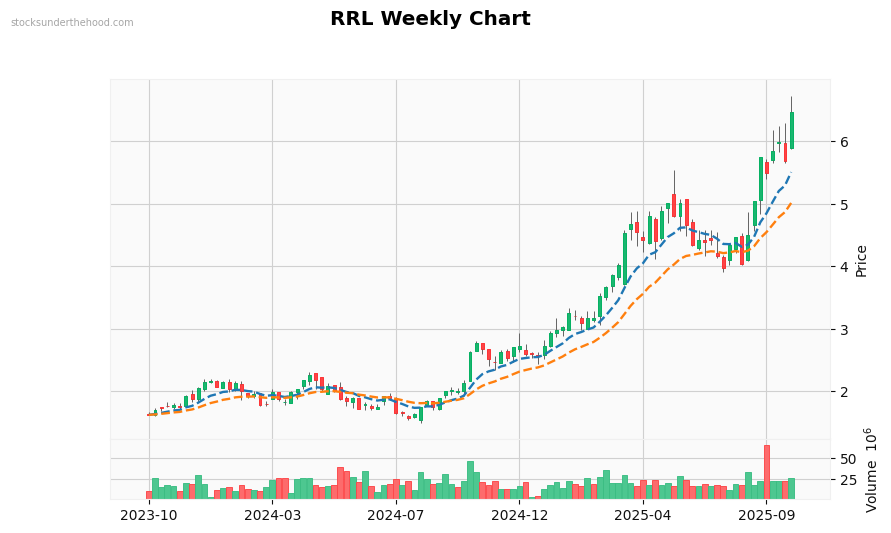
Weekly Observations: Performance: +266.9% (2Y). Volume is significantly above average. with strong buying interest. Currently in a strong uptrend. Trading above EMA10. Trading above EMA21. Price is above all EMAs (bullish signal). EMAs are stacked bullishly. Price is at recent highs.
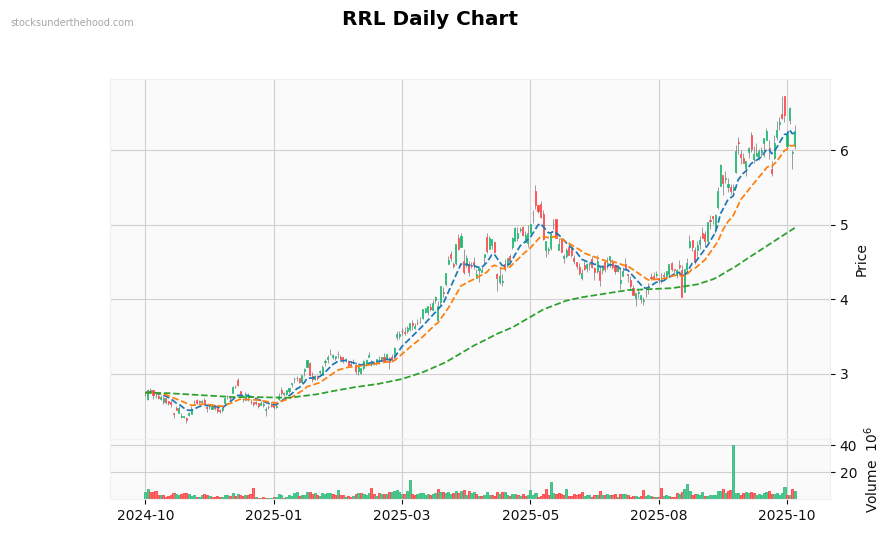
Daily Observations: Performance: +127.8% (1Y). Volume is above average. Recent volume spike detected. Currently moving sideways with mixed signals. Trading near EMA10. Trading above EMA21. Trading above EMA125. Price is above all EMAs (bullish signal). EMAs are stacked bullishly. Price is near recent highs.