PNI Technical Analysis
Last updated: October 23, 2025 at 11:31 PM
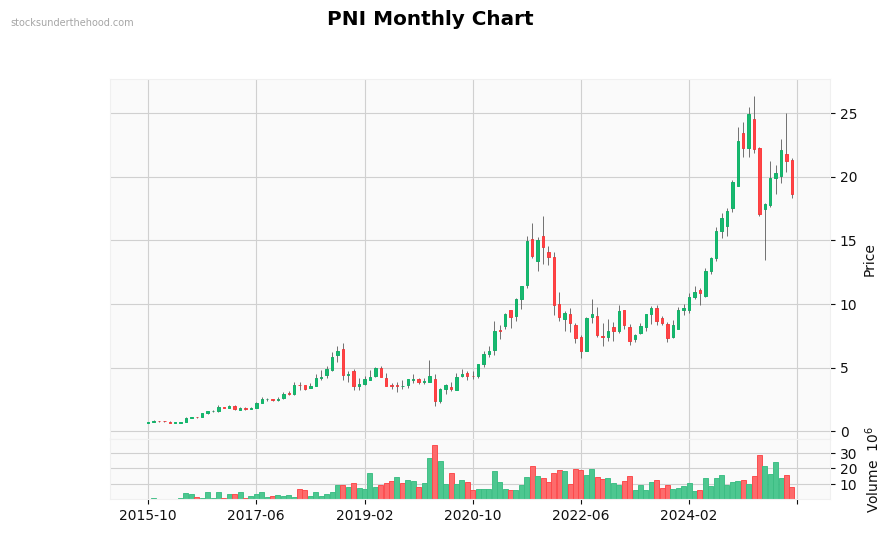
Monthly Observations: Performance: +2461.7% (10Y). Volume is significantly above average. with heavy selling pressure. Recent volume spike detected. Currently in a strong downtrend. Strong long-term uptrend (+180.8% over 2 years). Moderate volatility. Up 3037% from lows. Price is in the middle of recent range.
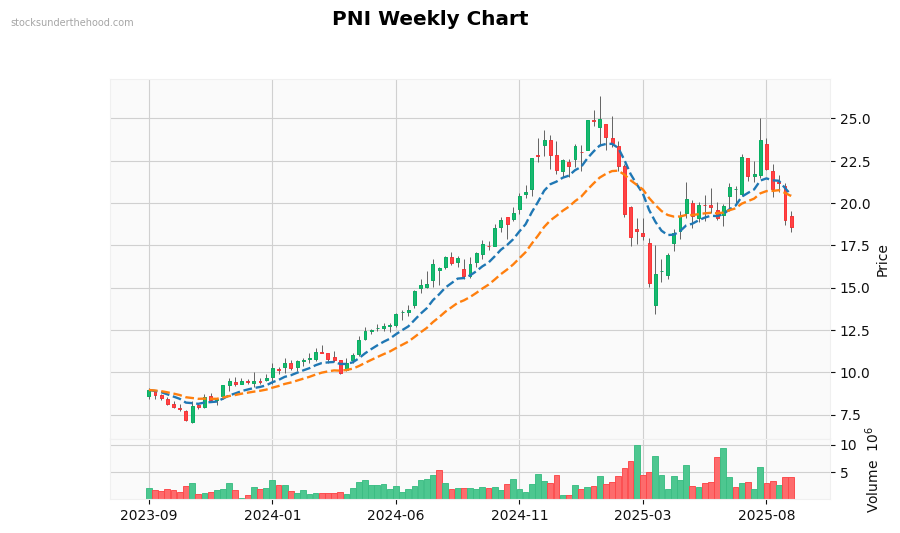
Weekly Observations: Performance: +184.4% (2Y). Volume is significantly above average. suggesting potential breakout preparation. Recent volume spike detected. Currently in a strong uptrend. Trading above EMA10. Trading above EMA21. Price is above all EMAs (bullish signal). EMAs are stacked bearishly, but price above EMAs suggests potential support. Price is in the middle of recent range.
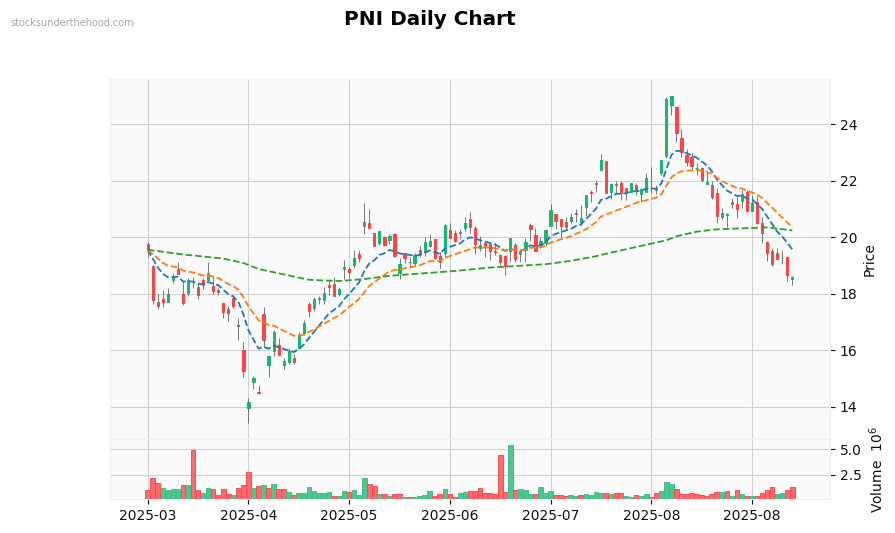
Daily Observations: Performance: +11.5% (1Y). Volume is significantly above average. with strong buying interest. Recent volume spike detected. Currently in a strong uptrend. Trading above EMA10. Trading above EMA21. Trading above EMA125. Price is above all EMAs (bullish signal). EMAs show mixed signals. Price is in the middle of recent range.