PMV Technical Analysis
Last updated: October 23, 2025 at 11:31 PM
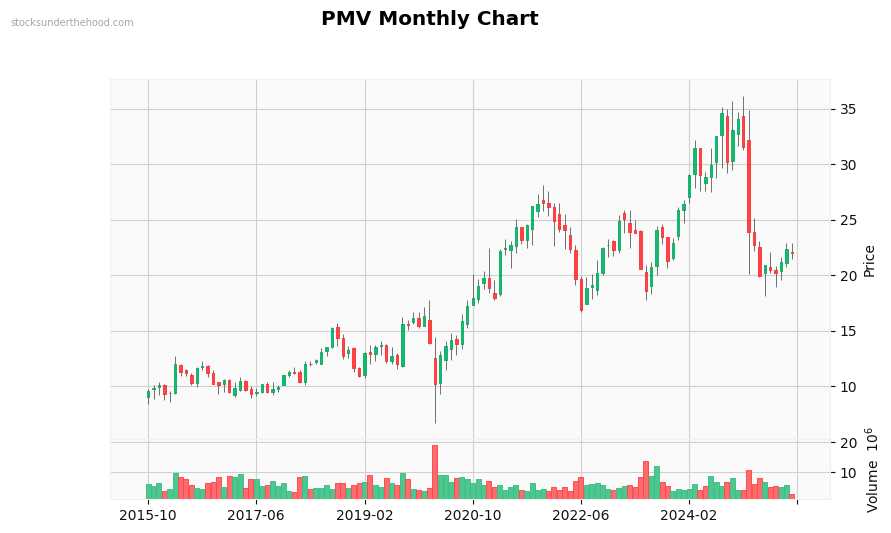
Monthly Observations: Performance: +84.6% (10Y). Volume is near average. Currently in a strong downtrend. Sideways long-term movement (-16.2% over 2 years). Moderate volatility. Price is near recent lows.
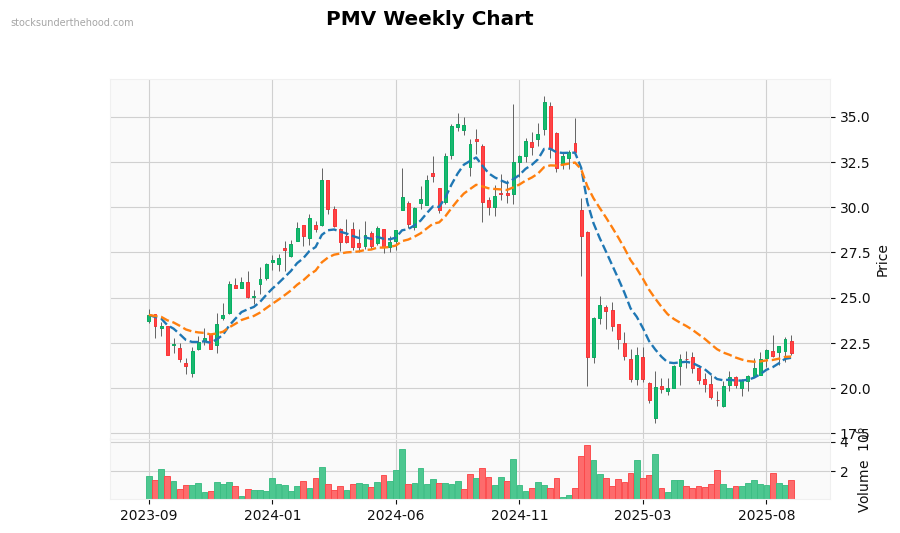
Weekly Observations: Performance: -15.8% (2Y). Volume is significantly above average. with heavy selling pressure. Currently in a strong downtrend. Trading below EMA10. Trading below EMA21. Price is below most EMAs (negative). EMAs are stacked bearishly, but price above EMAs suggests potential support. Price is at recent lows.
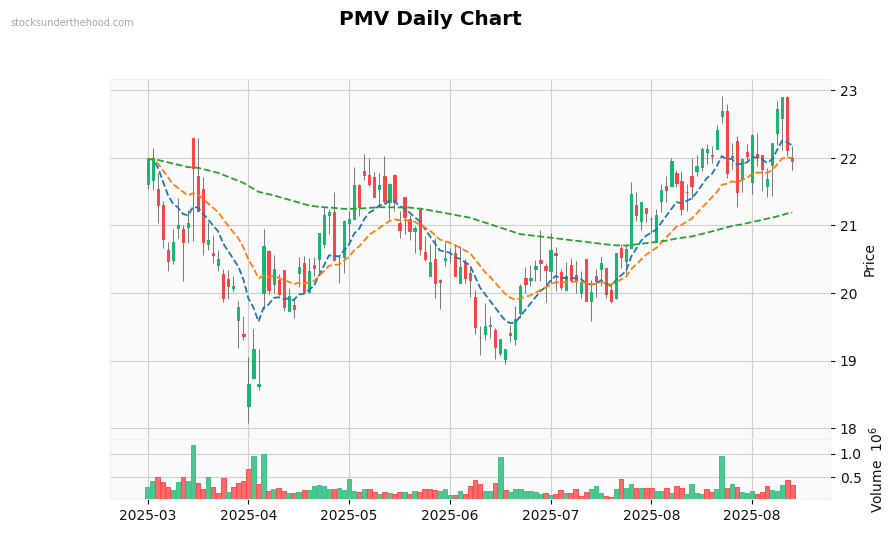
Daily Observations: Performance: -42.1% (1Y). Volume is above average. Currently moving sideways with mixed signals. Trading below EMA10. Trading below EMA21. Trading below EMA125. Price is below most EMAs (negative). EMAs are stacked bearishly, but price above EMAs suggests potential support. Price is at recent lows.