NST Technical Analysis
Last updated: October 23, 2025 at 11:30 PM
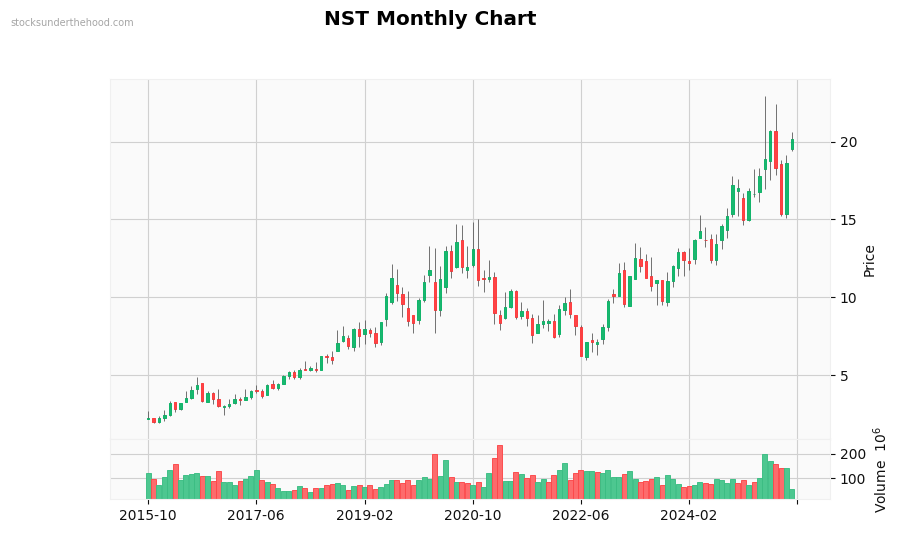
Monthly Observations: Performance: +1131.6% (10Y). Volume is significantly above average. with strong buying interest. Recent volume spike detected. Currently in a strong uptrend. Candlestick patterns: Doji (indecision). Strong long-term uptrend (+118.3% over 2 years). Moderate volatility. Down 9.1% from highs. Up 1168% from lows. Price is at recent highs.
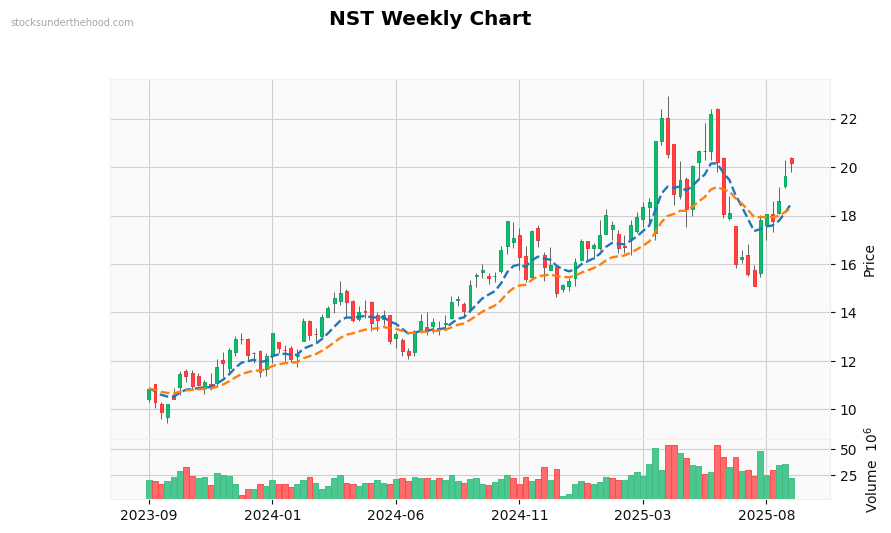
Weekly Observations: Performance: +111.9% (2Y). Volume is significantly above average. with strong buying interest. Recent volume spike detected. Currently in a strong uptrend. Trading above EMA10. Trading above EMA21. Price is above all EMAs (bullish signal). EMAs are stacked bullishly. Price is near recent highs.
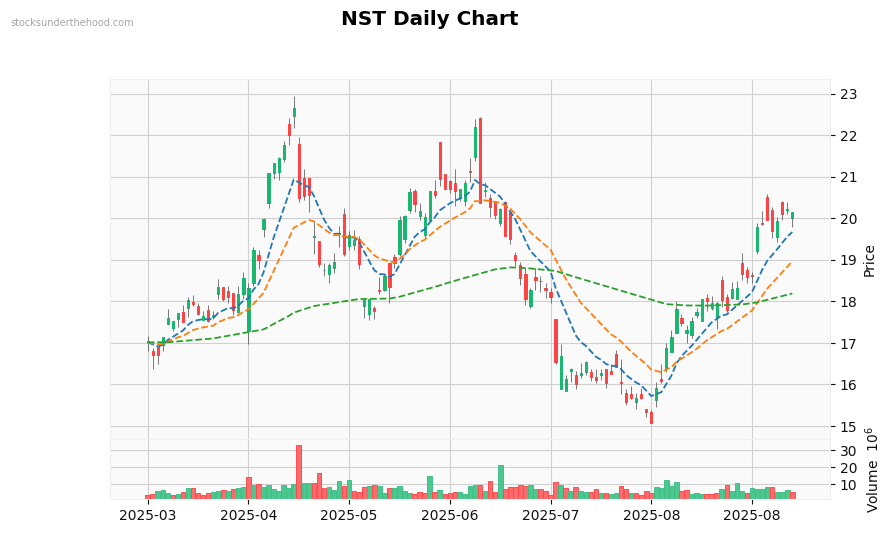
Daily Observations: Performance: +42.5% (1Y). Volume is above average. Currently moving sideways with mixed signals. Trading below EMA10. Trading near EMA21. Trading above EMA125. EMAs are stacked bullishly. Price is near recent highs.