LBL Technical Analysis
Last updated: September 10, 2025 at 11:53 PM
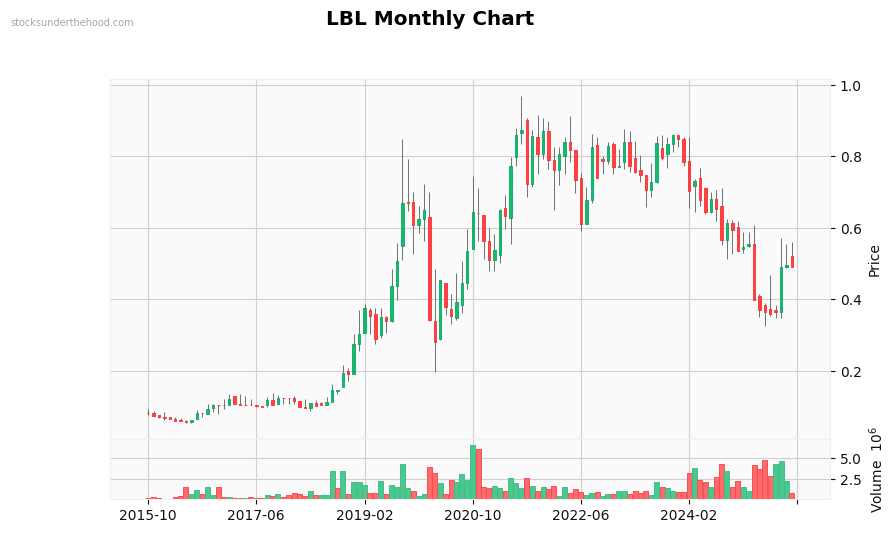
Monthly Observations: Performance: +507.2% (10Y). Volume is significantly above average. with heavy selling pressure. Recent volume spike detected. Currently in a strong downtrend. Candlestick patterns: Bearish Engulfing. Long-term downtrend (-38.3% over 2 years). Moderate volatility. Up 802% from lows. Strong 6-month momentum. Price is in the middle of recent range.
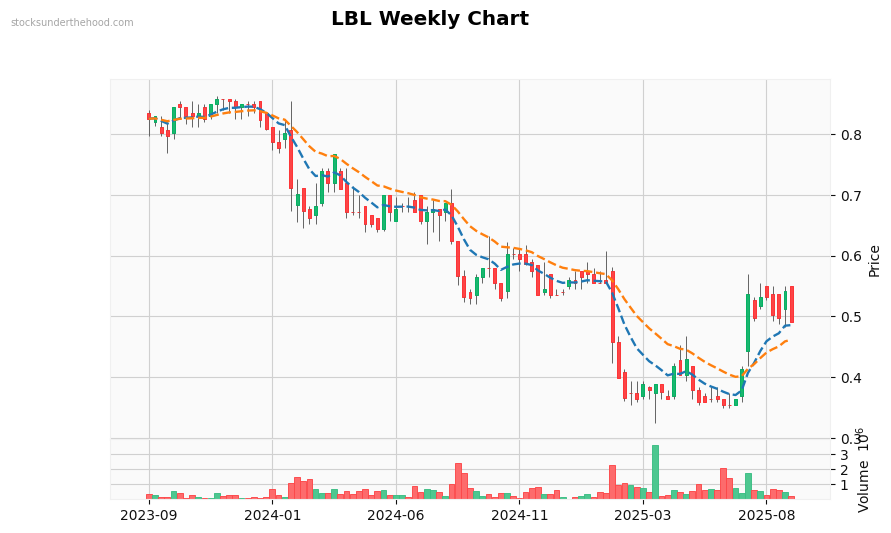
Weekly Observations: Performance: -40.6% (2Y). Volume is above average. Currently in a strong downtrend. Trading above EMA10. Trading above EMA21. Price is above all EMAs (bullish signal). EMAs are stacked bullishly. Price is in the middle of recent range.
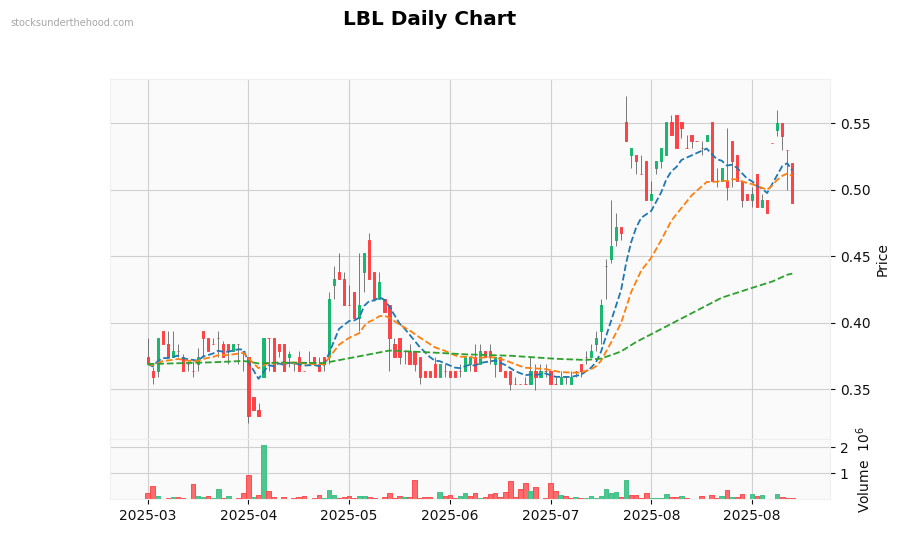
Daily Observations: Performance: +32.8% (6M). Volume is below average. Currently in a strong downtrend. Trading below EMA10. Trading below EMA21. Trading above EMA125. Price is below most EMAs (negative). EMAs are stacked bullishly. Price is in the middle of recent range.