HUB Technical Analysis
Last updated: October 23, 2025 at 11:27 PM
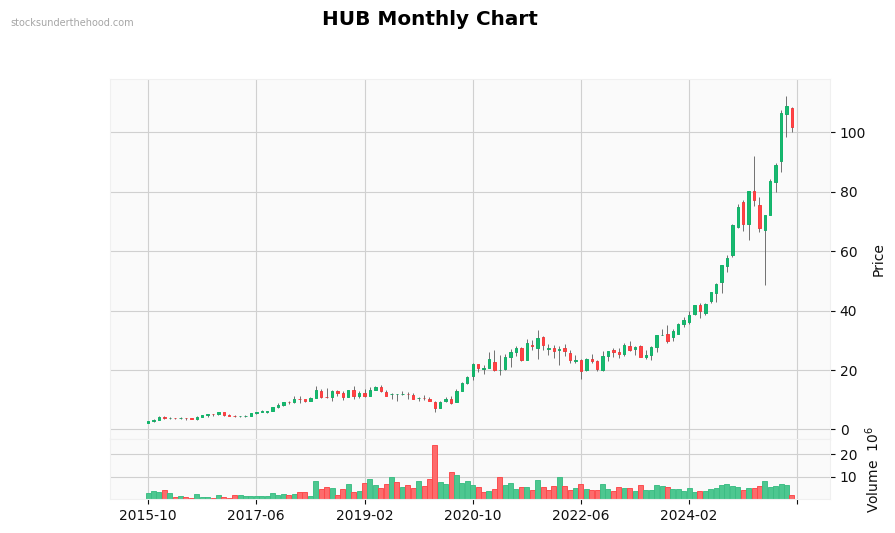
Monthly Observations: Performance: +3417.2% (10Y). Volume is above average. with strong buying interest. Currently in a strong uptrend. Candlestick patterns: Bullish Engulfing. Strong long-term uptrend (+280.6% over 2 years). Moderate volatility. Down 7.1% from highs. Up 4366% from lows. Strong 6-month momentum. Price is at recent highs.
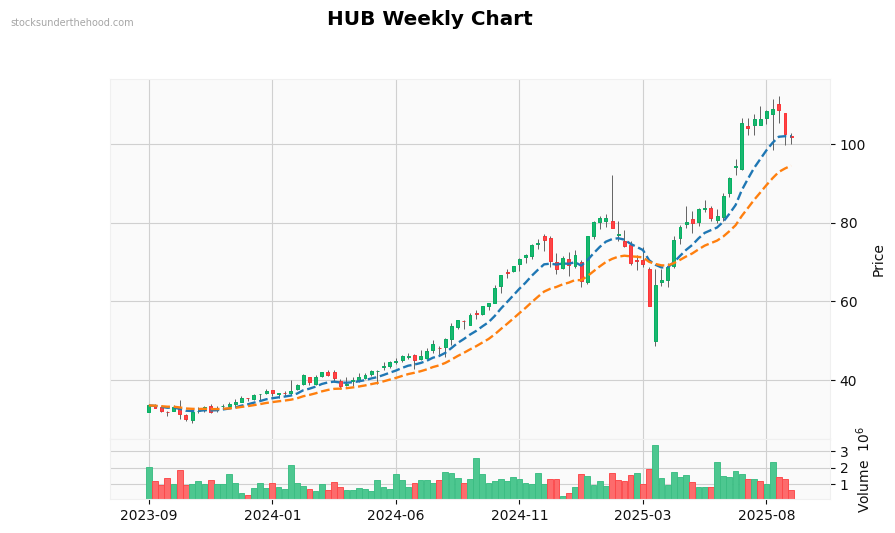
Weekly Observations: Performance: +277.6% (2Y). Volume is significantly above average. with strong buying interest. Recent volume spike detected. Currently in a strong uptrend. Trading above EMA10. Trading above EMA21. Price is above all EMAs (bullish signal). EMAs are stacked bullishly. Price is at recent highs.
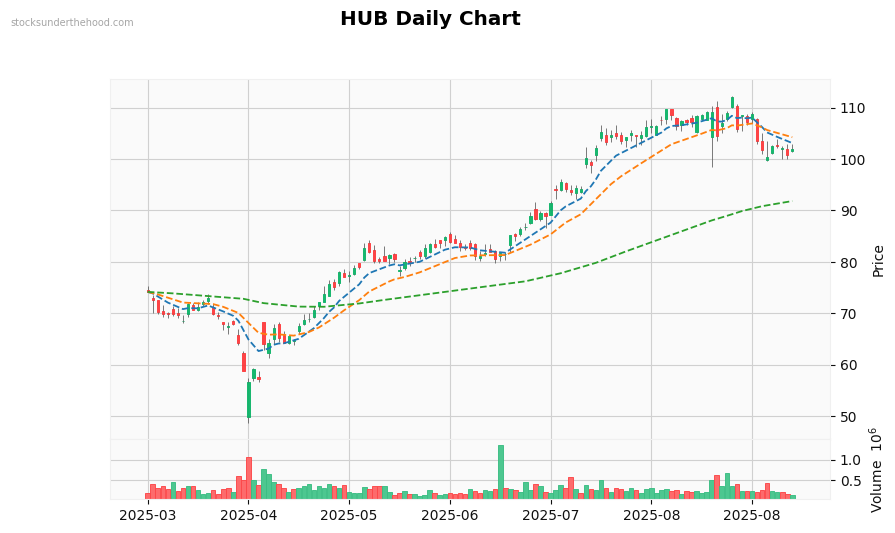
Daily Observations: Performance: +69.6% (1Y). Volume is significantly above average. with strong buying interest. Recent volume spike detected. Currently in a strong uptrend. Trading above EMA10. Trading above EMA21. Trading above EMA125. Price is above all EMAs (bullish signal). EMAs are stacked bullishly. Price is in the middle of recent range.