DGT Technical Analysis
Last updated: October 23, 2025 at 11:25 PM
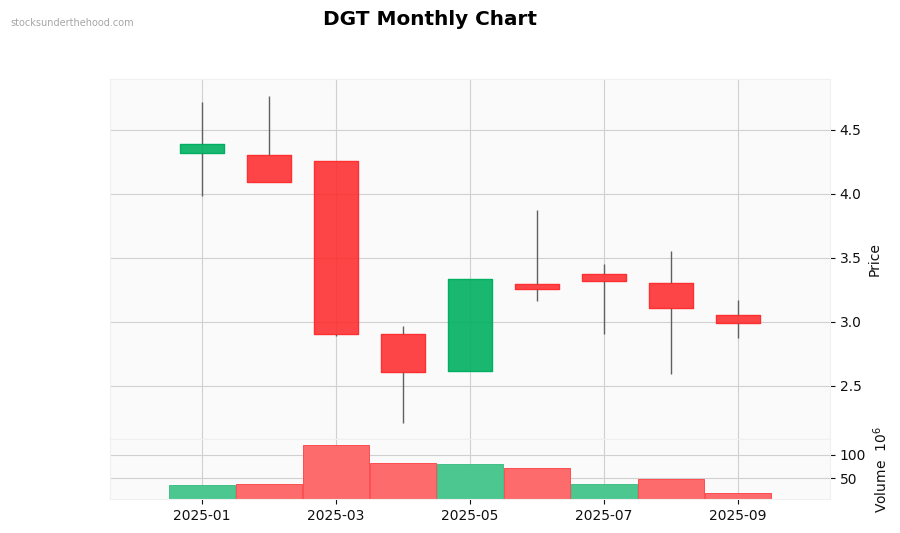
Monthly Observations: Performance: -37.1% (10Y). Volume data insufficient. Currently in a strong downtrend. Candlestick patterns: Shooting Star/Inverted Hammer. Insufficient data for comprehensive monthly analysis. Price is near recent lows.
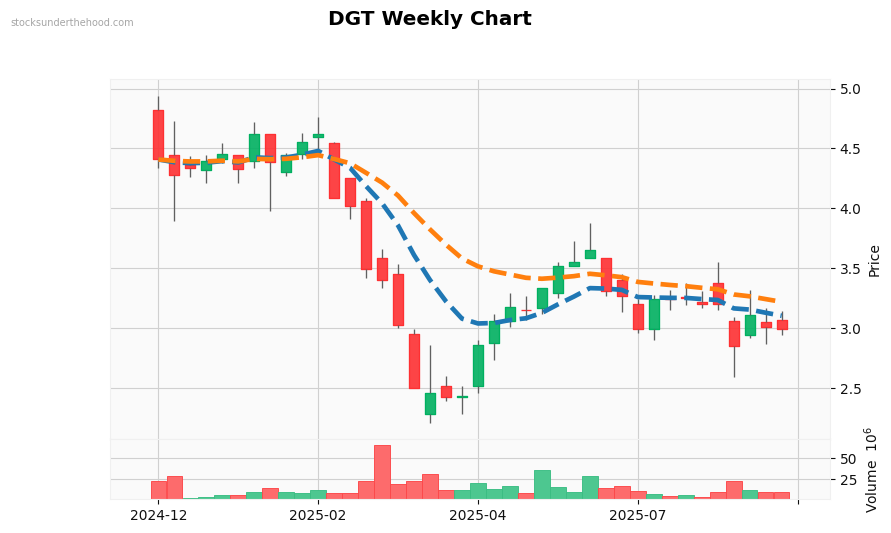
Weekly Observations: Performance: -37.4% (2Y). Volume is near average. Currently in a strong downtrend. Trading below EMA10. Trading below EMA21. Price is below most EMAs (negative). EMAs are stacked bearishly, but price above EMAs suggests potential support. Price is near recent lows.
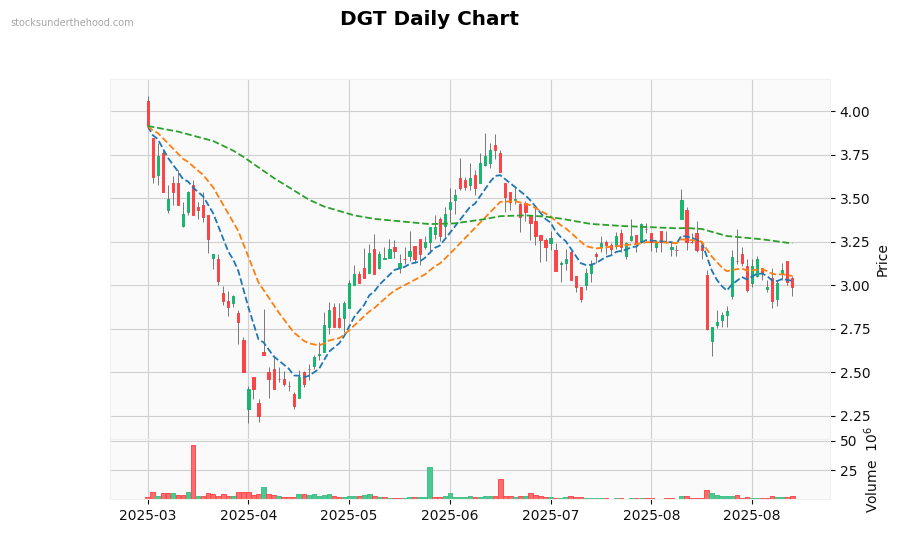
Daily Observations: Performance: -37.4% (1Y). Volume is below average. Currently in a downtrend. Trading below EMA10. Trading below EMA21. Trading below EMA125. Price is below most EMAs (negative). EMAs are stacked bearishly, but price above EMAs suggests potential support. Price is near recent lows.