CU6 Technical Analysis
Last updated: October 23, 2025 at 11:24 PM
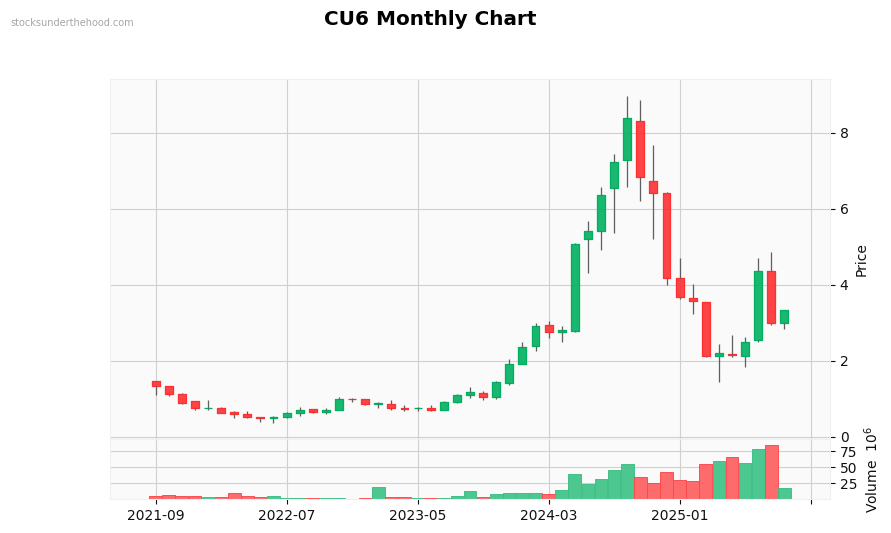
Monthly Observations: Performance: +242.5% (10Y). Volume is significantly above average. with strong buying interest. Recent volume spike detected. Currently in a strong downtrend. Strong long-term uptrend (+337.1% over 2 years). High volatility stock. Up 1175% from lows. Strong 6-month momentum. Price is in the middle of recent range.
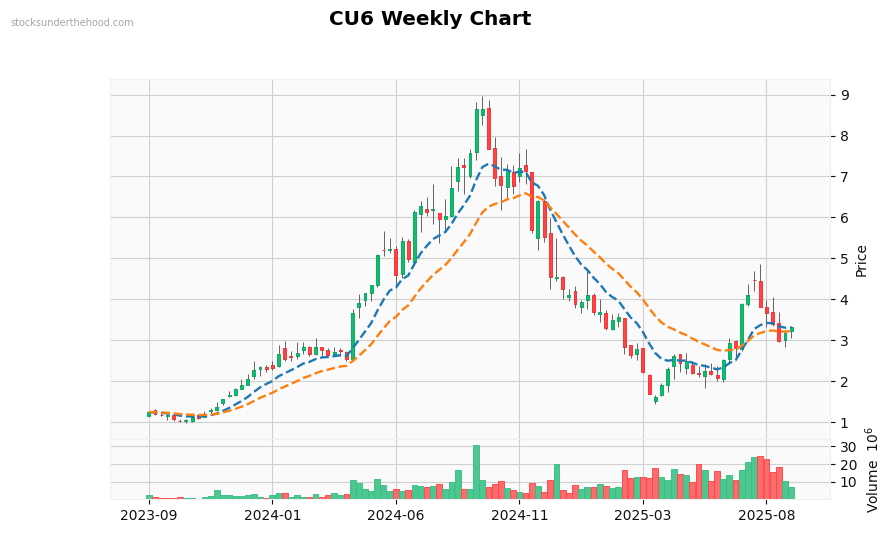
Weekly Observations: Performance: +337.1% (2Y). Volume is significantly above average. with strong buying interest. Recent volume spike detected. Currently in a strong uptrend. Trading above EMA10. Trading above EMA21. Price is above all EMAs (bullish signal). EMAs are stacked bullishly. Price is in the middle of recent range.
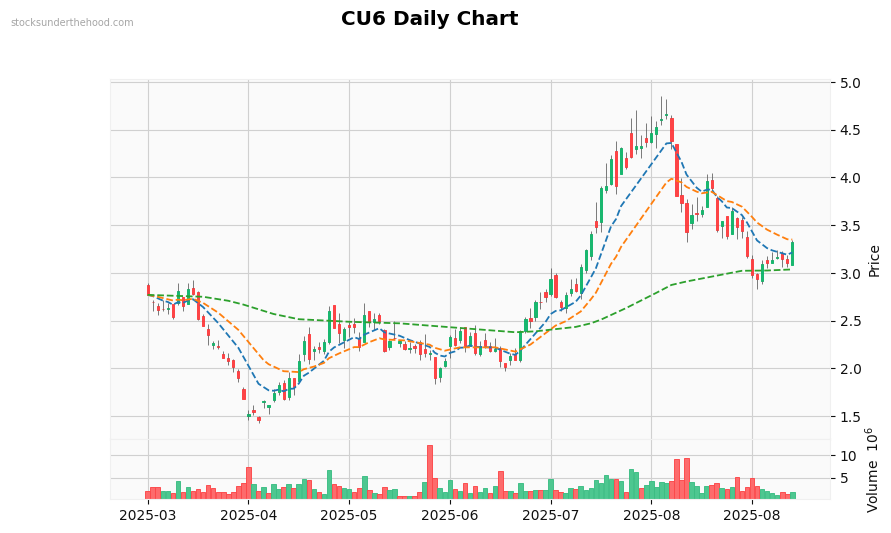
Daily Observations: Performance: -31.4% (1Y). Volume is significantly above average. with heavy selling pressure. Currently in a strong downtrend. Trading below EMA10. Trading below EMA21. Trading above EMA125. Price is below most EMAs (negative). EMAs are stacked bullishly. Price is in the middle of recent range.