CEH Technical Analysis
Last updated: October 23, 2025 at 11:23 PM
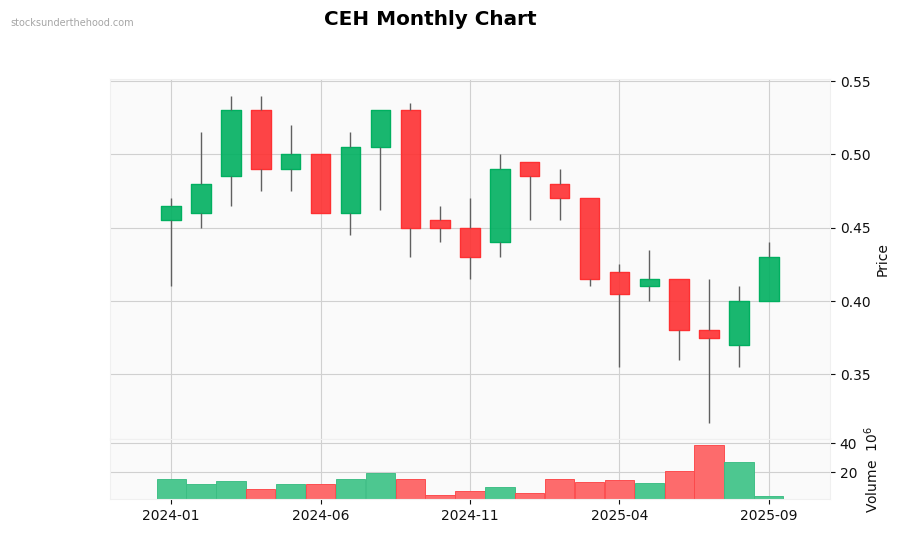
Monthly Observations: Performance: -14.0% (10Y). Volume is significantly above average. with heavy selling pressure. Recent volume spike detected. Currently in a strong downtrend. Low volatility, stable movement. Still near historical lows. Price is near recent lows.
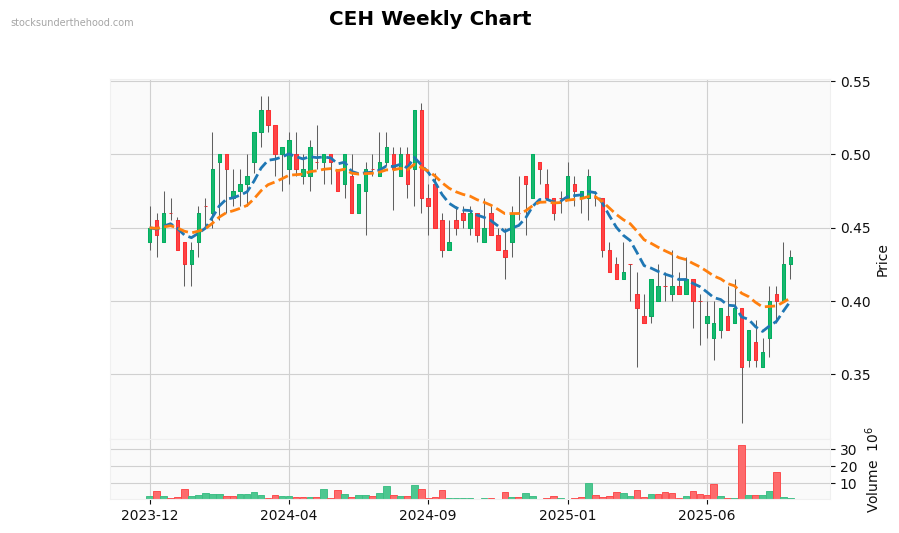
Weekly Observations: Performance: -11.1% (2Y). Volume is near average. Currently in a strong downtrend. Trading below EMA10. Trading below EMA21. Price is below most EMAs (negative). EMAs are stacked bullishly. Price is in the middle of recent range.
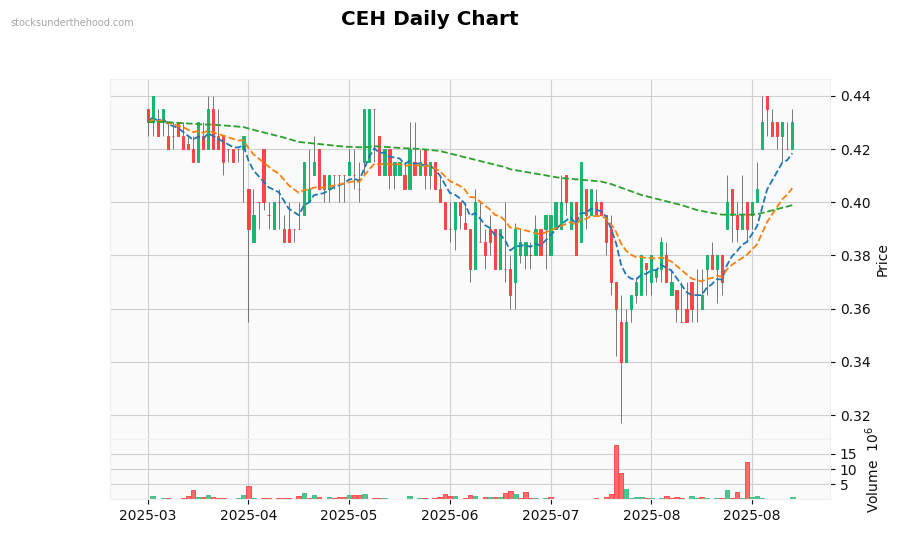
Daily Observations: Performance: -13.0% (1Y). Volume is below average. Currently moving sideways with mixed signals. Trading below EMA10. Trading below EMA21. Trading below EMA125. Price is below most EMAs (negative). EMAs show mixed signals. Price is in the middle of recent range.