CCL Technical Analysis
Last updated: October 23, 2025 at 11:22 PM
📊 Monthly Overview
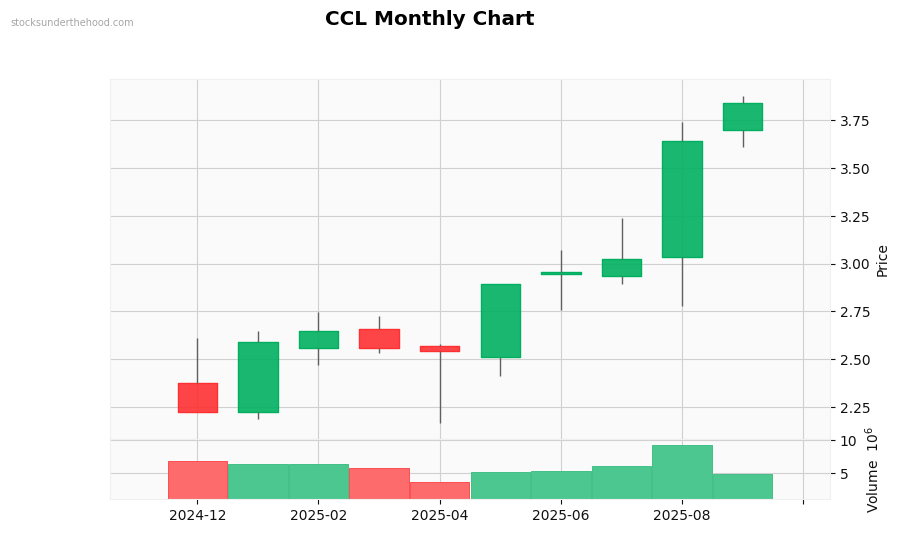
Monthly Observations: Performance: +85.6% (10Y). Volume data insufficient. Currently in a strong uptrend. Insufficient data for comprehensive monthly analysis. Price is at recent highs.
📈 Weekly Trend
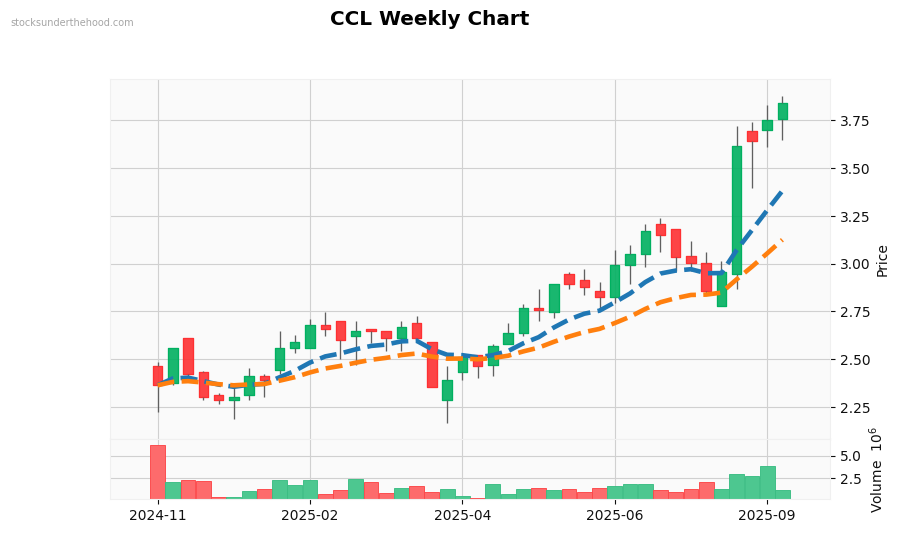
Weekly Observations: Performance: +74.7% (2Y). Volume is above average. Currently in a strong uptrend. Trading above EMA10. Trading above EMA21. Price is above all EMAs (bullish signal). EMAs are stacked bullishly. Price is at recent highs.
⚡ Daily Action
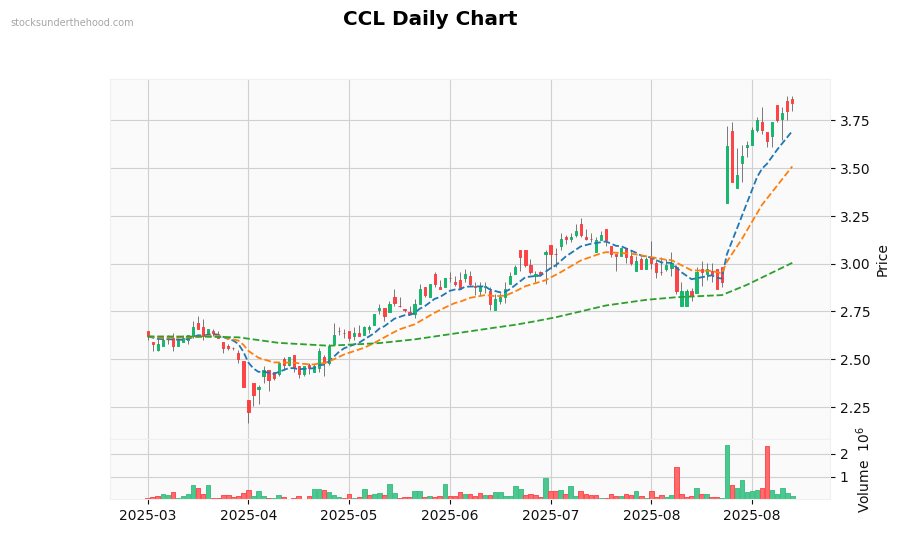
Daily Observations: Performance: +81.5% (1Y). Volume is near average. Currently moving sideways with mixed signals. Trading above EMA10. Trading above EMA21. Trading above EMA125. Price is above all EMAs (bullish signal). EMAs are stacked bullishly. Price is at recent highs.