BUB Technical Analysis
Last updated: October 23, 2025 at 11:21 PM
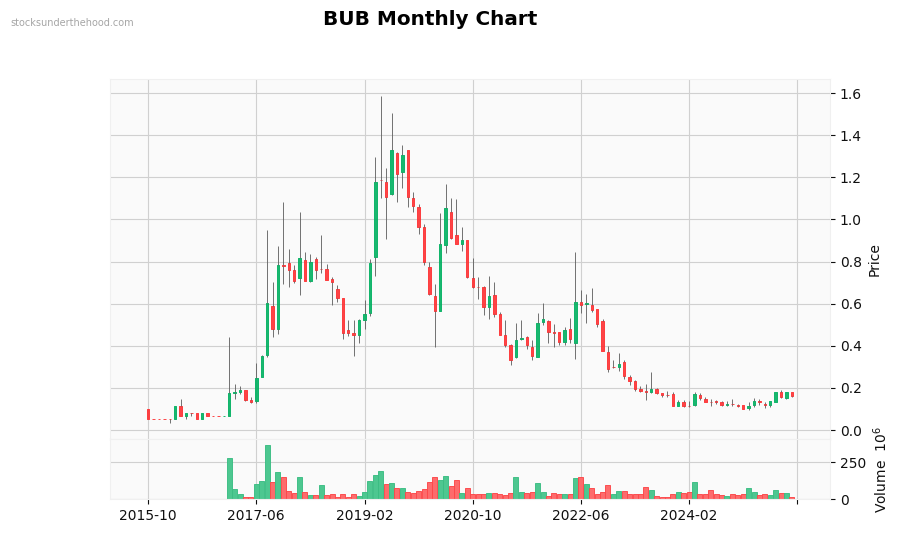
Monthly Observations: Performance: +215.2% (10Y). Volume is near average. Currently in a strong uptrend. Sideways long-term movement (-6.1% over 2 years). High volatility stock. Price is near recent lows.
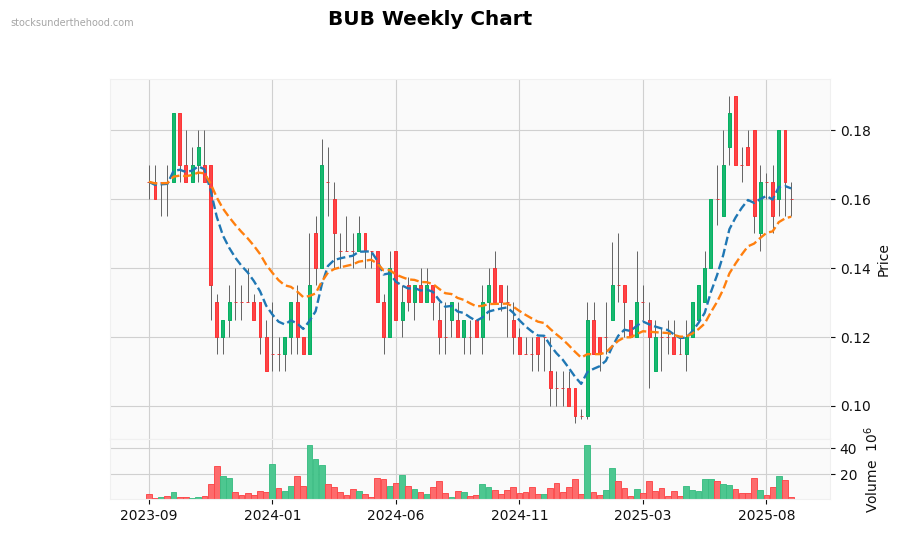
Weekly Observations: Performance: -6.1% (2Y). Volume is near average. Currently in a strong downtrend. Trading above EMA10. Trading above EMA21. Price is above all EMAs (bullish signal). EMAs are stacked bullishly. Price is in the middle of recent range.
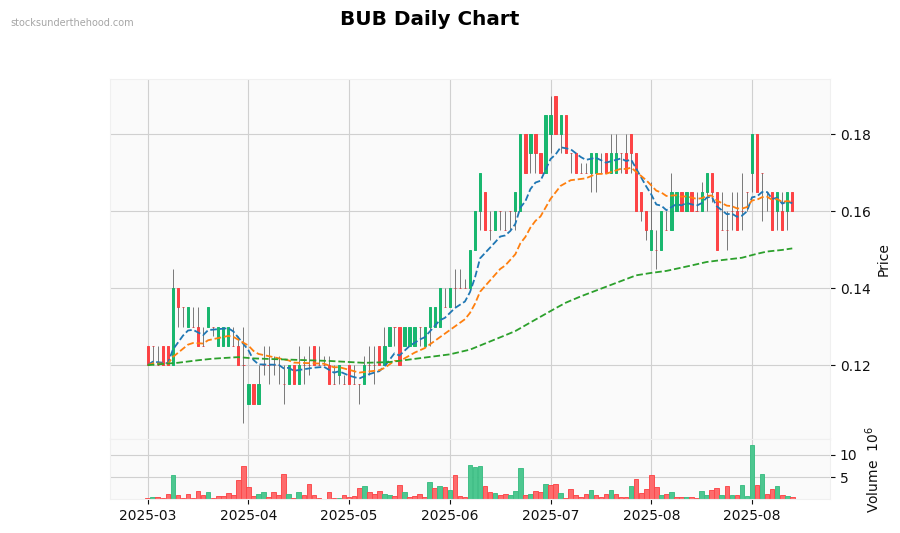
Daily Observations: Performance: +24.0% (1Y). Volume is below average. Recent volume spike detected. Currently in a strong uptrend. Trading above EMA10. Trading above EMA21. Trading above EMA125. Price is above all EMAs (bullish signal). EMAs are stacked bearishly, but price above EMAs suggests potential support. Price is in the middle of recent range.