BOQ Technical Analysis
Last updated: October 23, 2025 at 11:21 PM
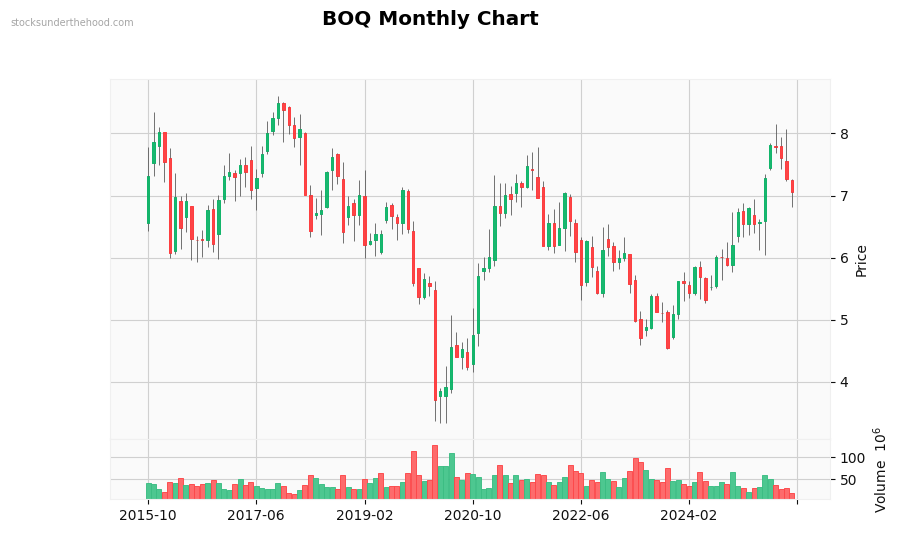
Monthly Observations: Performance: -6.6% (10Y). Volume is near average. Currently in a strong uptrend. Strong long-term uptrend (+57.1% over 2 years). Low volatility, stable movement. Down 15.5% from highs. Price is in the middle of recent range.
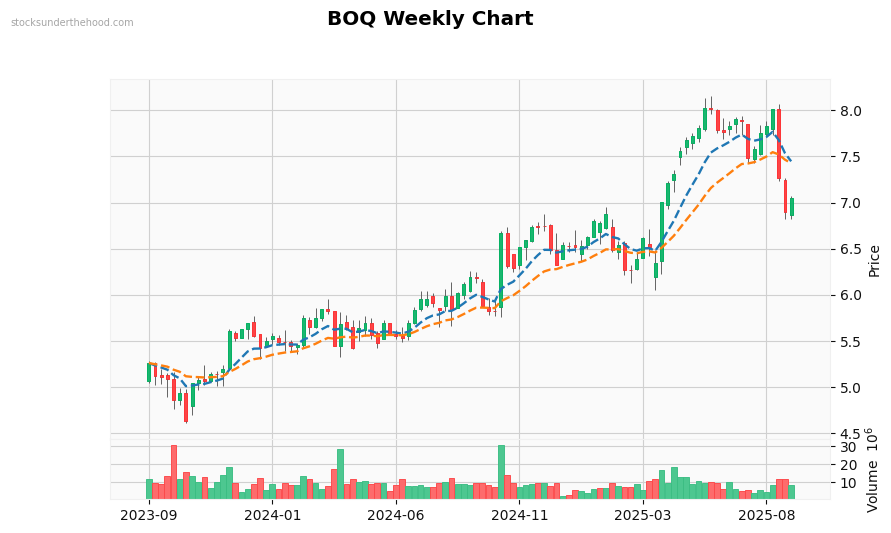
Weekly Observations: Performance: +54.1% (2Y). Volume is above average. Currently in an uptrend. Trading below EMA10. Trading below EMA21. Price is below most EMAs (negative). EMAs are stacked bearishly, but price above EMAs suggests potential support. Price is in the middle of recent range.
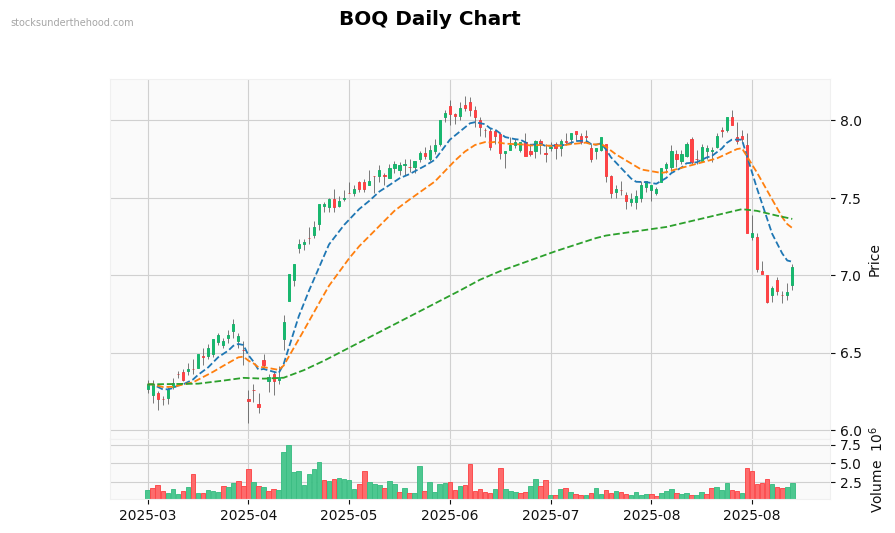
Daily Observations: Performance: +9.7% (1Y). Volume is significantly above average. suggesting potential breakout preparation. Recent volume spike detected. Currently moving sideways with mixed signals. Trading near EMA10. Trading below EMA21. Trading below EMA125. Price is below most EMAs (negative). EMAs are stacked bearishly, but price above EMAs suggests potential support. Price is in the middle of recent range.